Trading platform
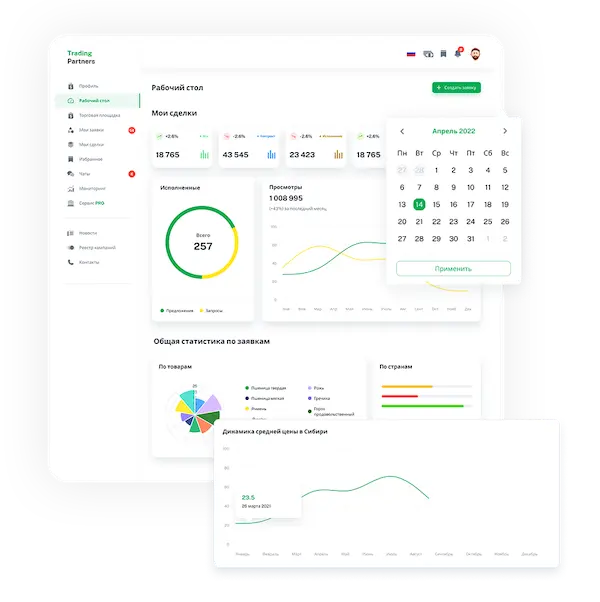
 Monitoring
  Express applications
 Fork Work
 Service
  News
News  Directory
 Trading platform


Sugar, 01.03.2025-29.03.2025


Analysis of price monitoring data for sugar
2025 © FORKAGRO
General dynamics of average price sugar from 01.03.2025 - 29.03.2025
Dynamics of the average price sugar from 01.03.2025 - 29.03.2025
Far Eastern Federal District
Siberian Federal District
Ural federal district
Volga Federal District
Central Federal District
Northwestern Federal District
Southern Federal District
Monitoring reflects the dynamics of purchase prices of processing and grain trading organizations. The schedule is based on the prices of RUB/t without VAT. The data is updated weekly and is the basis for calculating the commodity index (Producer Price Index, PPI). The index is an indicator of the current average price level and is calculated as the weighted average price of the regions.
Dynamics by city
| City | Price RUB/t |
|---|---|
| Angarsk |
73000.00 RUB
793.79 EUR
860.13 USD
6291.53 CNY
|
| Barnaul |
67171.43 RUB
730.41 EUR
791.46 USD
5789.19 CNY
|
| Bogdanovich |
64500.00 RUB
701.36 EUR
759.98 USD
5558.96 CNY
|
| Chelyabinsk |
64226.67 RUB
698.39 EUR
756.76 USD
5535.40 CNY
|
| Ekaterinburg |
65206.67 RUB
709.04 EUR
768.31 USD
5619.86 CNY
|
| Irkutsk |
71587.50 RUB
778.43 EUR
843.49 USD
6169.79 CNY
|
| Izhevsk |
63900.00 RUB
694.83 EUR
752.91 USD
5507.24 CNY
|
| Kazan |
63300.00 RUB
688.31 EUR
745.84 USD
5455.53 CNY
|
| Kemerovo |
67777.78 RUB
737.00 EUR
798.60 USD
5841.45 CNY
|
| Khabarovsk |
75333.33 RUB
819.16 EUR
887.62 USD
6492.63 CNY
|
| Krasnodar |
59300.00 RUB
644.82 EUR
698.71 USD
5110.79 CNY
|
| Krasnoyarsk |
67766.67 RUB
736.88 EUR
798.47 USD
5840.49 CNY
|
| Lipetsk |
59300.00 RUB
644.82 EUR
698.71 USD
5110.79 CNY
|
| Moscow |
62981.25 RUB
684.84 EUR
742.08 USD
5428.06 CNY
|
| Nizhny Novgorod |
63500.00 RUB
690.49 EUR
748.20 USD
5472.77 CNY
|
| Novokuznetsk |
69000.00 RUB
750.29 EUR
813.00 USD
5946.79 CNY
|
| Novosibirsk |
67789.47 RUB
737.13 EUR
798.74 USD
5842.46 CNY
|
| Omsk |
67062.50 RUB
729.22 EUR
790.17 USD
5779.81 CNY
|
| Penza |
62333.33 RUB
677.80 EUR
734.45 USD
5372.22 CNY
|
| Saint Petersburg |
63500.00 RUB
690.49 EUR
748.20 USD
5472.77 CNY
|
| Samara |
61050.00 RUB
663.84 EUR
719.33 USD
5261.62 CNY
|
| Vladimir |
66000.00 RUB
717.67 EUR
777.65 USD
5688.23 CNY
|
| Yoshkar-Ola |
63460.00 RUB
690.05 EUR
747.73 USD
5469.32 CNY
|
100
Chart connection code
<script type="text/javascript" src="https://forkagro.com/en/panel/chart/graph-widget?productId=32&dateFrom=01.03.2025&dateTo=29.03.2025"></script>
<div id='widgetGraphContainer'></div>
<div id='widgetGraphContainer'></div>
Graph widget on your website
Sugar - wholesale purchase prices per week
Monitoring reflects the dynamics of purchase prices of processing and grain trading organizations. The schedule is based on the prices of RUB/t without VAT. The data is updated weekly and is the basis for calculating the commodity index (Producer Price Index, PPI).
Prices are collected from the websites of companies once a week, until 09:00 (Moscow time) and until 20:00 (Moscow time) and are for informational purposes only. Forkagro.com is not responsible for the discrepancy between the prices presented and the current sales prices.